Liquidity Pro Map [ChartPrime]⯁ OVERVIEW
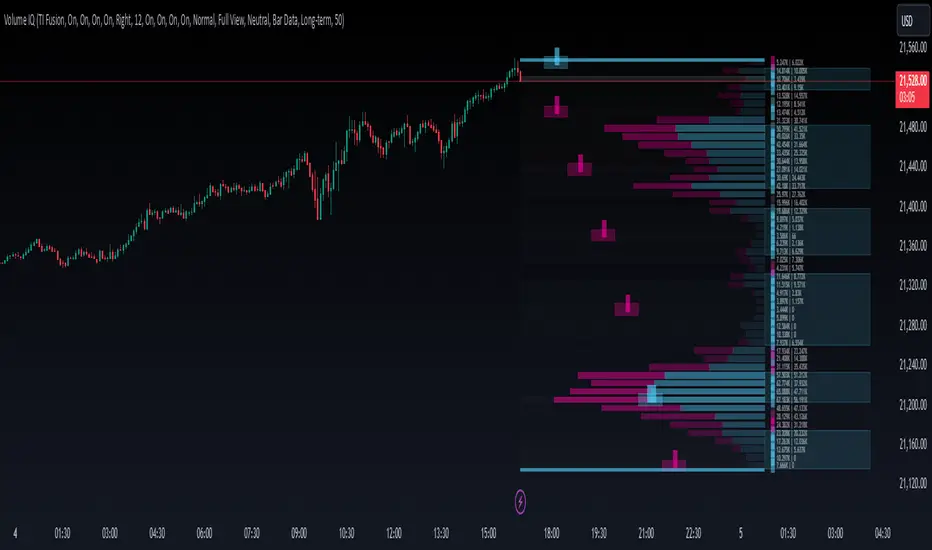
Liquidity Pro Map is a market-structure tool that simulates liquidity distribution by splitting price history into buy-side and sell-side profiles. Using candle volume and the standard deviation of close, the indicator builds two mirrored volume maps on the right-hand side of the chart. It also extends liquidity levels backwards in time until they are crossed by price, allowing you to see which zones remain untouched and where liquidity is most likely resting. Cumulative skew lines and highlighted POC levels give additional clarity on imbalance between buyers and sellers.
⯁ KEY FEATURES
Dual Liquidity Profiles: The chart is divided into buy-side (green) and sell-side (red) liquidity profiles, letting you instantly compare both sides of order flow.
Level Extension Logic: Each liquidity level is extended back in time until price crosses it. If not crossed, it persists all the way to the indicator’s lookback period, marking zones that remain “untapped.”
Dynamic Binning with Standard Deviation: The indicator distributes candle volumes into bins using close-price deviation, creating a more realistic liquidity map than static price levels.
priceDeviation = ta.stdev(close, 25) * 2
priceReference = close > open ? low - priceDeviation : high + priceDeviation
Cumulative Volume Skew Lines: Polylines on the right-hand side show the aggregated buy and sell volume profiles, making it easy to spot imbalance.
POC Identification: Highest-volume levels on both sides are marked as POC (Point of Control) , providing key zones of interest.
Clear Color Coding: Gradient shading intensifies with volume concentration—dark teal/green for buy zones, dark pink/red for sell zones.
⯁ HOW IT WORKS (UNDER THE HOOD)
Volume Distribution: Each bar’s volume is assigned to a price bin based on its reference price (close ± standard deviation offset).
Buy vs. Sell Splitting: If bins above last close price, volume is allocated to sell-side liquidity; otherwise, it’s allocated to buy-side liquidity.
Level Extension: Boxes marking liquidity bins extend back until crossed by price. If uncrossed, they anchor all the way to the start of the lookback window.
Cumulative Polylines: As bins are stacked, cumulative buy and sell values form skew polylines plotted at the right edge.
POC Levels: The highest-volume bin on each side is highlighted with labels and arrows, marking where the heaviest liquidity is concentrated.
⯁ USAGE
Use buy/sell profiles to see where liquidity is likely resting. Green shelves suggest potential support zones; red shelves suggest resistance or sell liquidity pools.
Watch untouched extended levels —these often become magnets for price as liquidity is swept.
Track POC levels as primary liquidity targets, where reactions or fakeouts are most common.
Compare cumulative skew lines to judge which side dominates in volume. Heavy buy skew may indicate absorption of sell pressure, and vice versa.
Adjust lookback period to switch between intraday liquidity maps and larger swing-based profiles.
Use separator feature to hide bins borders for better visual clarity.
Use as a confluence tool with OBs, support/resistance, and liquidity sweep setups.
⯁ CONCLUSION
Liquidity Pro Map transforms candle volume into a structured simulation of where liquidity may rest across the chart. By dividing buy vs. sell profiles, extending untouched levels, and marking cumulative skew and POC, it equips traders with a clear visual map of potential liquidity pools. This allows for better anticipation of sweeps, reversals, and areas of high market activity.
Pine Script®指标